Claude Now Builds Interactive Visuals Inline — On All Plans
Anthropic shipped a notable update to Claude on March 12: the chatbot can now generate interactive charts, diagrams, and visualizations directly inside conversations — no code required, no side panel, no export step.
Inline, Temporary, and Context-Aware
Unlike Claude's existing Artifacts (which are permanent, shareable outputs), these new visuals are designed to be ephemeral. They appear inline in Claude's responses and evolve as the conversation progresses — disappearing or updating when the context shifts. Anthropic frames them as tools for understanding in the moment, not polished deliverables.
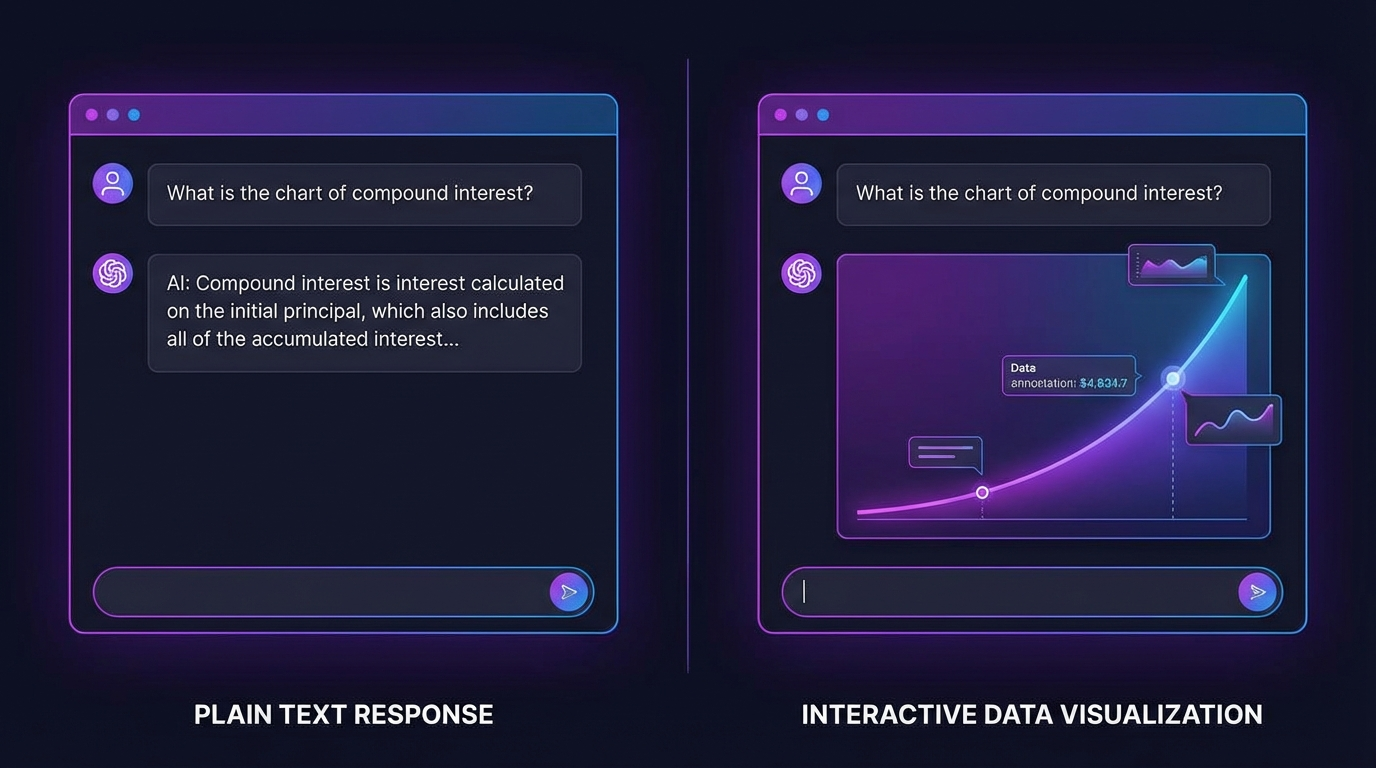
Some examples Anthropic highlighted: asking about compound interest produces an interactive curve you can adjust; asking about the periodic table generates a clickable element grid with details on demand. The system works for data charts, idea maps, engineering diagrams, and step-by-step visual guides.
On by Default, Free Tier Included
The feature is rolling out in beta across all Claude plan types — including the free tier. Claude decides when a visual would help, but users can also request one explicitly with prompts like "draw this as a diagram" or "visualize how this might change over time."
The update builds on "Imagine with Claude," a limited preview Anthropic ran last fall. It also connects with Claude's existing integrations with Figma, Canva, and Slack.
A UX Differentiator
The move positions Claude as a more visual interface compared to competitors that still rely primarily on text output. With chat-native dynamic graphics that update mid-conversation, Anthropic is betting that interactivity — not just accuracy — is the next frontier for AI assistants.