Arm Uses Model Explorer to Expose Edge AI Compiler Bottlenecks
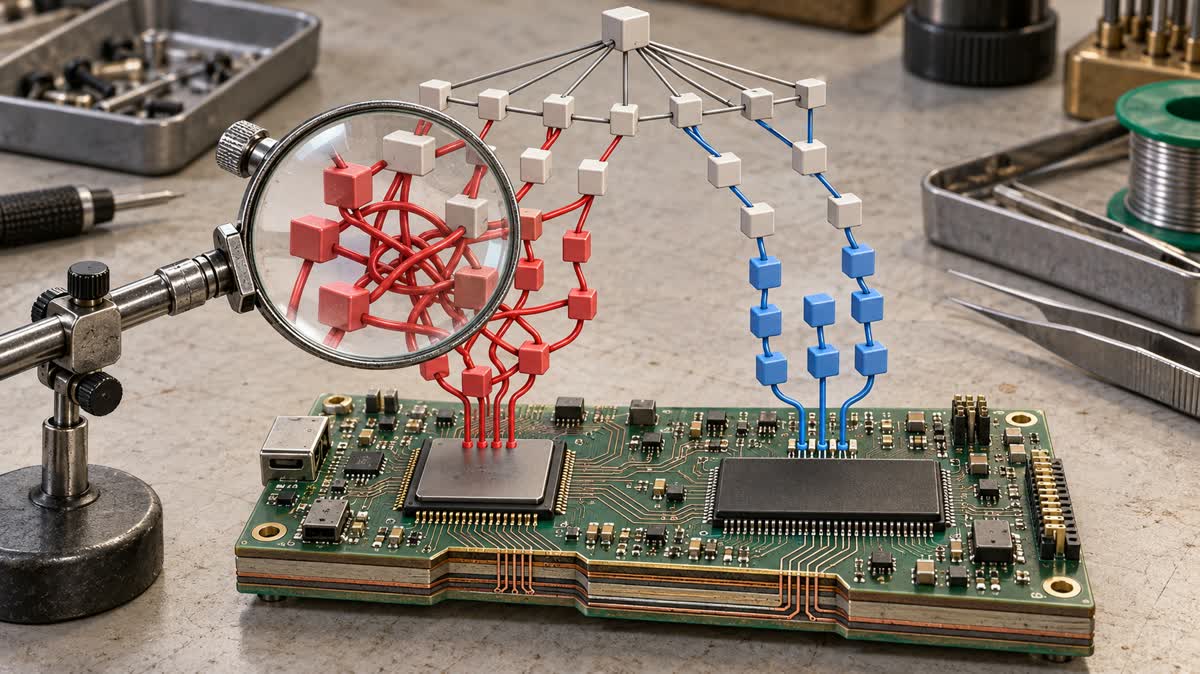
Google published an October 20 engineering case study showing how Arm uses Model Explorer to debug compiled edge-AI models, including unintended graph transformations and CPU fallback. The workflow uses Arm's open-source adapters for TOSA, VGF and PTE formats rather than relying only on high-level neural-network diagrams.
The practical problem is that exporting a model can change what actually executes. Quantization, operator fusion and hardware delegation can leave developers with a graph that behaves differently from the original framework representation.
Finding what changed
In one example, Google says Arm inspected a neural super-sampling model exported through the ExecuTorch Arm backend into VGF for Vulkan ML Extensions. The visualization exposed unintended TRANSPOSE operators introduced by a backend change, helping engineers resolve the regression without manually analyzing raw logs.
A separate example compares CPU and NPU-delegated versions of a YOLO vision model side by side. The NPU graph groups the network into an EthosUBackend block, while partially supported models can reveal operators that remain outside accelerator execution.
For profiling, Arm overlaid cycle-level traces from its Fixed Virtual Platform simulator onto the graph. Google's account says a single TRANSPOSE node emerged as the main latency bottleneck. This is a simulator-based debugging example, not a published hardware speedup benchmark.
Available tooling
Arm's repositories confirm that the VGF and PTE adapters can be installed through PyPI and loaded as Model Explorer extensions. Both currently require Python 3.10 through 3.12; PTE visualization covers Ethos-U, VGF and XNNPACK targets.
For deployment teams, the useful capability is inspecting where compilation changes execution before treating model-level accuracy or aggregate latency as sufficient validation.